
Stock Market Outlook entering the Week of July 14th = Uptrend
- ADX Directional Indicators: Uptrend
- On Balance Volume Indicator: Uptrend
- Institutional Activity (Price & Volume): Uptrend
ANALYSIS
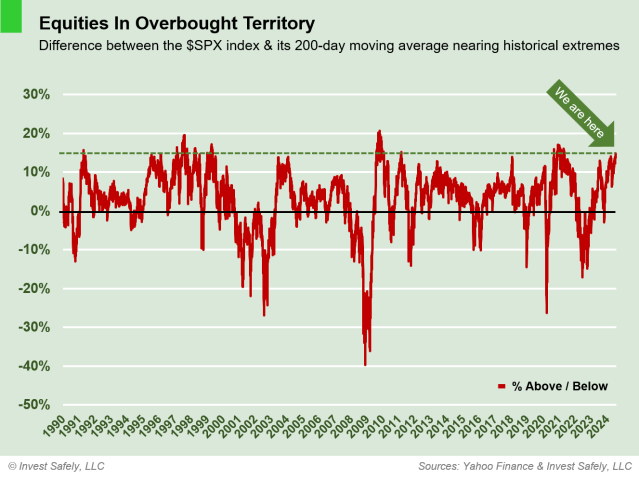
The stock market outlook shows an uptrend in place for U.S. equities, as the index nears historical extremes verses a well known technical indicator.
The S&P500 ($SPX) rallied 0.9% last week. The index now sits ~5% above the 50-day moving average and ~14% above the 200-day moving average.
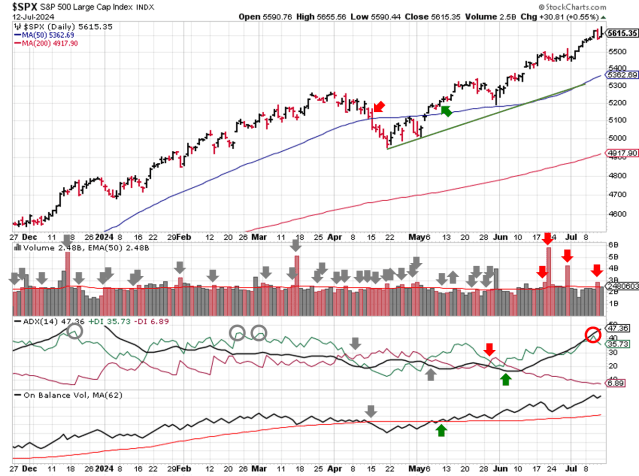
SPX Price & Volume Chart – July 14 2024
All three indicators (ADX, On Balance Volume and Institutional activity) remain bullish. That said, remember the SPX doesn’t spend much time this far above the 200-day. We last noted the 14% level in the March 24th weekend update, just prior to the April correction.
Last week’s advance saw the return of market breadth, with recent winners (e.g. $XLC, $XLK) lagging and oversold sectors leading. Of course, the drop in interest rates helped rate sensitive sectors (e.g. $XLRE, $XLU), but materials and health care also performed well.
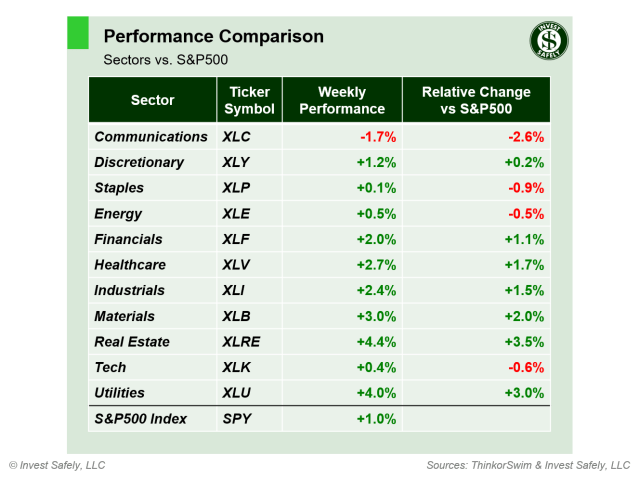
S&P Sector Performance for Week 28 of 2024
This shift in market breadth benefited small caps the most, with growth and value names significantly outperforming other styles. On the other side of the coin, large/mega cap growth names underperformed, along with safety plays like quality and momentum.
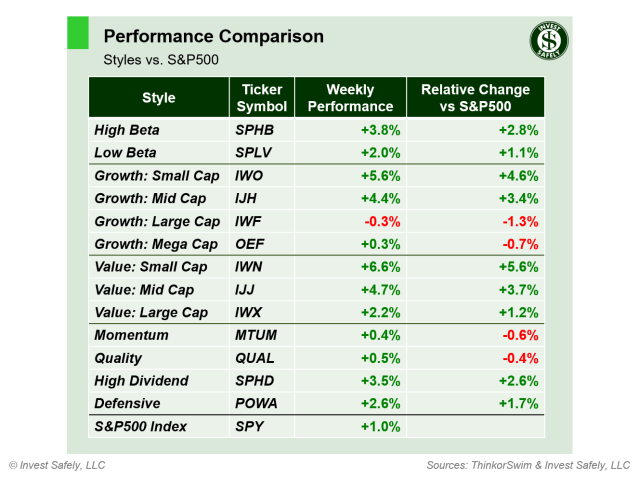
Sector Style Performance for Week 28 of 2024
Bitcoin led all asset classes, after 5 weeks on the downside, while oil underperformed.
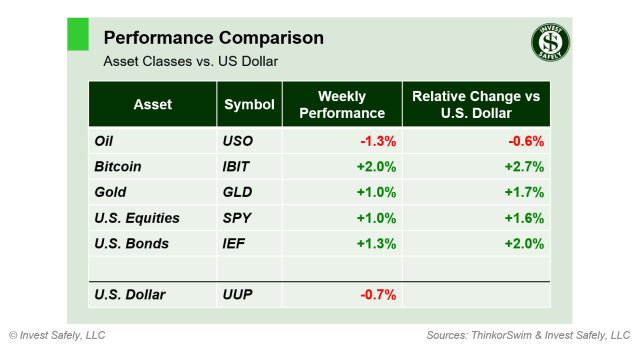
Asset Class Performance for Week 28 2024
COMMENTARY
Federal Reserve Chair Powell didn’t rock the boat with any of his comments last week, instead towing the line of data dependency. Market odds for a September rate cut have increased, although inflation readings continue to show signs of “stickiness”.
The consumer price index (CPI) fell for a third straight month, down to 3% y/y in June, from 3.3% y/y in May.
| CPI (y/y) | Actual | Prior |
Expected |
| Headline | +3.0% | +3.3% | +3.1% |
| Core | +3.3% | +3.4% | +3.4% |
On the other hand, Producer prices (PPI) increased 2.6% y/y in June, rising from 2.4% in May (and that’s after May’s number was revised higher from 2.2% to 2.4%).
| PPI (y/y) | Actual | Prior |
Expected |
| Headline | +2.6% | +2.4%* | +2.3% |
| Core | +3.0% | +2.6%* | +2.5% |
In terms of price action, Thursday’s session was most interesting. The SPX ended the day down, despite ~80% the companies in the index closing higher. This dynamic is the market breadth issue we’ve been seeing recently, only this time in the negative direction. The largest market capitalization stocks (i.e. Mag 7) encountered aggressive selling, thereby taking the index along for the ride.
Best to Your Week!
P.S. If you find this research helpful, please tell a friend.
If you don’t, tell an enemy.


