
Stock Market Outlook entering the Week of June 16th = Uptrend
- ADX Directional Indicators: Uptrend
- On Balance Volume Indicator: Uptrend
- Institutional Activity (Price & Volume): Uptrend
ANALYSIS
The stock market outlook shows an uptrend in place for U.S. equities.
The S&P500 ($SPX) rose 1.6% last week. The index ended the week ~4% above the 50-day moving average and ~13% above the 200-day moving average.
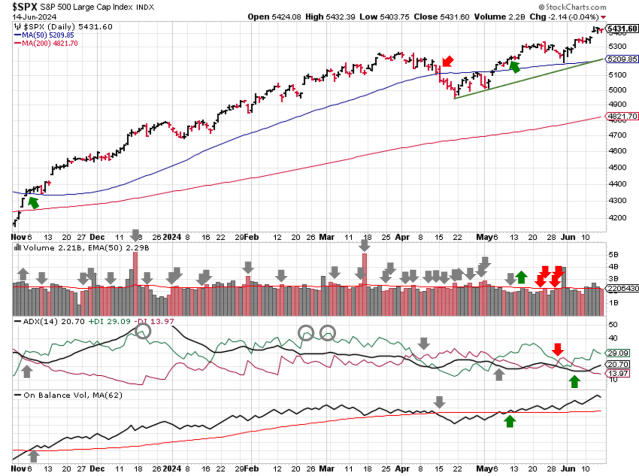
SPX Price & Volume Chart for the Week of June 16 2024
All three indicators (ADX, On Balance Volume and Institutional activity) remain bullish, thanks in large part to technology stocks.
So it’s no surprise to see the Tech sector ($XLK) leading the way last week. What is a bit of a surprise? All of the other sectors underperforming versus the index. That’s not a sign of a healthy market, but we have to play the cards we have, not the cards we want.
Energy ($XLE) led to the downside. Energy sector stocks have not been kind to investors since April. Industrials and Financials also weakening significantly over the past month.
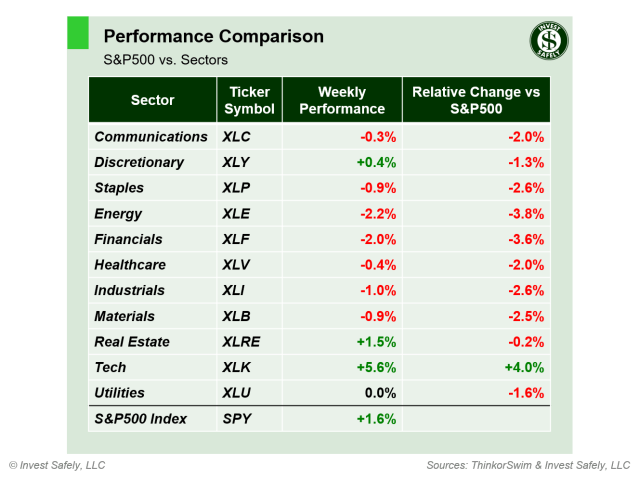
S&P Sector Performance for Week 24 of 2024
Oil was the big winner last week, rallying 4.2% and reclaiming its 200-day moving average after a rough couple of months. Bitcoin did not fair well, dropping 5.4% and is now looking for support from its 50-day moving average.
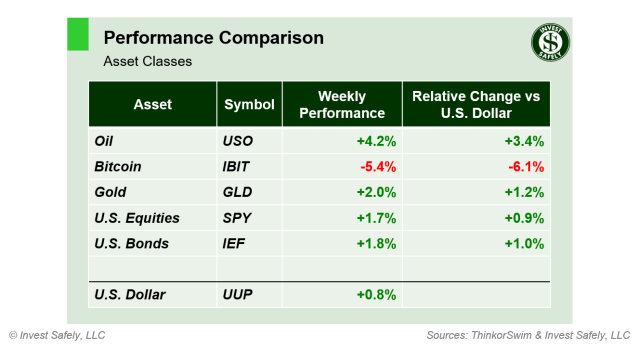
Asset Class Performance for Week 24 of 2024
COMMENTARY
The May Consumer Price Index (CPI) declined versus April and came in below expectations, giving stocks a boost mid-week as investors looked forward to eventual rate cuts.
| CPI (y/y) | Actual | Prior |
Expected |
| Headline | +3.3% | +3.4% | +3.4% |
| Core | +3.4% | +3.6% | +3.5% |
The Producer Price Index also showed signs of improvement, although that was due to an upward revision in the April figures (prior Headline reading was +1.8%, prior Core reading was +2.1%).
| PPI (y/y) | Actual | Prior |
Expected |
| Headline | +2.2% | +2.3% | +2.5% |
| Core | +2.3% | +2.4% | +2.4% |
Despite seemingly positive inflation data, the U.S. FOMC decided to keep rates unchanged, citing the need for more evidence that inflation is really in the rear-view mirror.
For the week ahead, May retail sales figures are released on Tuesday, U.S. markets are closed Wednesday (Juneteenth holiday), and Quarterly options expiration is Friday.
Best to Your Week!
P.S. If you find this research helpful, please tell a friend.
If you don’t, tell an enemy.


