
Stock Market Outlook entering the Week of April 7th = Uptrend
- ADX Directional Indicators: Mixed
- Price & Volume Signals: Uptrend
- On Balance Volume Indicator: Uptrend
ANALYSIS
The stock market outlook remains in a uptrend, despite Thursday’s volatility.
The S&P500 ($SPX) dropped 1% last week, starting Q2 with a loss. The index also broke below the November trendline, though reaching a new high would re-establish the line and create a new support level. The index sits ~4% above the 50-day moving average, and ~12% above the 200-day moving average.
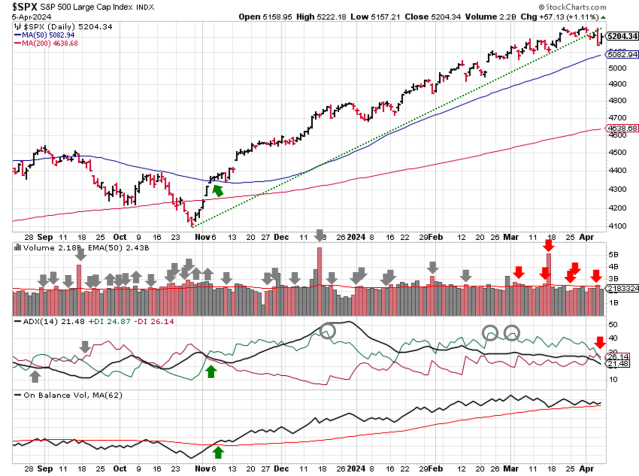
SPX Price & Volume Chart for the Week of Apr 07 2024
The ADX signal is borderline, crossing over by the slimmest of margins on Friday. Monday’s price action will determine if the signal can sustain the bearish view or reverts to bullish. Institutional selling is elevated, but not excessive, so the signal remains in an uptrend for this week. On Balance Volume also remains in an uptrend, but shows a negative divergence with price since mid-March.
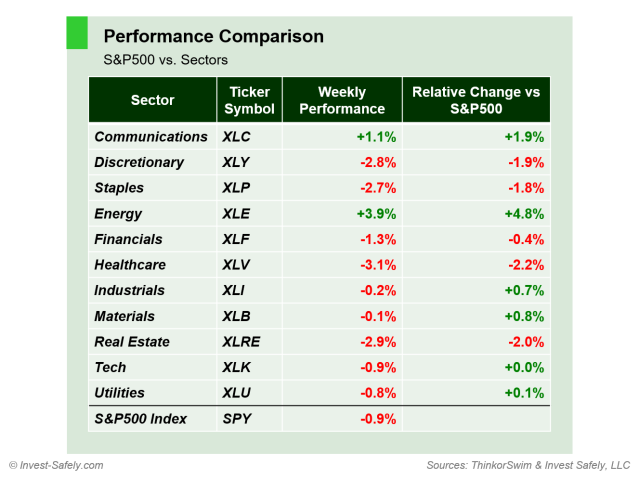
S&P Sector Performance for Week 14 of 2024
Sector-wise, Energy ($XLE) outperformed by a wide margin. Heathcare ($XLV) was the worst performer, although several sectors were in rough shape. Oil and gold were the top asset classes last week; bitcoin was the worst.
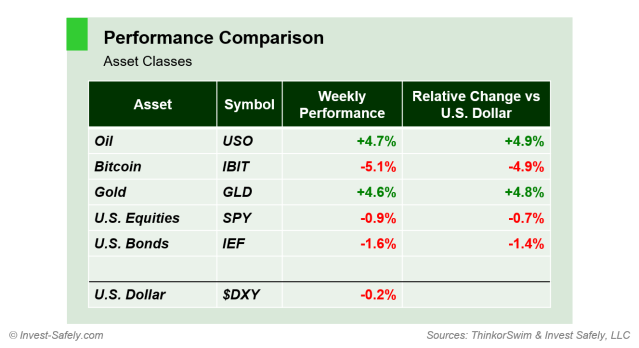
Asset Class Performance for Week 14 of 2024
COMMENTARY
ISM Manufacturing PMI showed an expansion (reading above 50) for the first time in 16 months! ISM Services PMI declined slightly, though still shows an expansion as well.
On the jobs front, JOLTS data was inline with expectations, while non-farm payrolls exceeded expectations, reaching its highest level in 10 months.
Speeches from Fed officials didn’t provide much excitement. Some commentators thought Neel Kashkari may have spooked the markets, leading to Thursday’s sell-off. His remarks were likely an example of correlation not causation. Instead:
This type of “sequenced” move rather than a simultaneous move suggests “somebody” (the proverbial ,”I heard of a guy”) blew up and position unwinds were the bigger story. Perhaps a dollar bull was short bitcoin and crude against 2yr bonds. Who knows? But somebody felt more pain than the rest of us.
This week, CPI data and FOMC minutes are published on Wednesday, followed by PMI data on Thursday.
Best to Your Week!
P.S. If you find this research helpful, please tell a friend.
If you don’t, tell an enemy.


