
Stock Market Outlook entering the Week of July 30th = Uptrend
- ADX Directional Indicators: Uptrend
- Price & Volume Signals: Uptrend
- Elliott Wave Analysis: Mixed
ANALYSIS
The stock market outlook remains in an uptrend as we close out the month of July.
The S&P500 ($SPX) rose 1% last week. No change versus key support levels; the index still sits ~5% and ~12% above the 50 and 200-day moving averages, respectively.

SPX Price & Volume Chart for the Week of July 30 2023
No change in signal for the ADX; a strong uptrend continues to unfold. Price/volume also remains in an uptrend, with almost no distribution taking place over the past 5 weeks.

SPX Elliott Wave Analysis for the Week of July 30 2023
Both Elliott Wave counts show the market in the final stage of the recent rally. A negative divergence in both the RSI(5) and the MACD are bearish near-term, though key support and resistance levels remain unchanged (4169 and 4632).
COMMENTARY
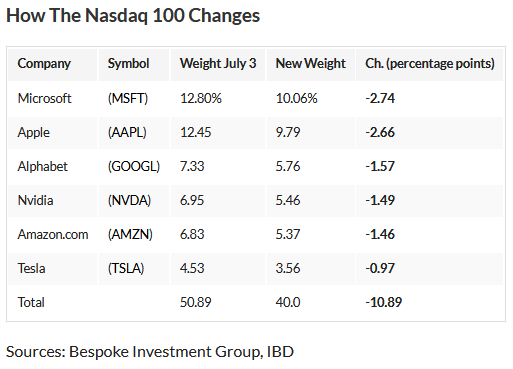
The NASDAQ 100 rebalance was a non-event, and doesn’t appear to have significantly impacted the overconentration problem. Per IBD:
Recapping last week’s economic data releases, manufacturing PMI surprised to the upside (vs. estimates) but remains in a contraction with a reading of 49. Services PMI fell to 52.4, which is the lowest reading in 5 months.
The U.S. FOMC raised rates 0.25%, and will evaluate further hikes at the next meeting.
The “advanced” GDP estimate for Q2 came in much higher than expected, particularly versus the y/y comparison, which was interpreted as a sign of economic strength.
And finally, PCE came in at +3% y/y, while core PCE was +4.1%. Both figures confirm the trends shown in CPI data; inflation continue to decline, but remains higher than the Fed target.
Another big week of earnings coming up, along with the latest jobs data:
I received a question or two on the US Treasuries General Account. Back in June, we discussed the unwind of “extraordinary measures” taken by the U.S. Treasury after we reached the debt ceiling.

U.S. Treasury Account – Weekly Average – 2023-07-30
https://fred.stlouisfed.org/series/WTREGEN
As of July 26, the account average was ~$
Best to Your Week!
P.S. If you find this research helpful, please tell a friend.
If you don’t, tell an enemy.


